UIA Data
MAPS
![]()
Driving more adaptive & responsive teaching through
AI-powered insightful, aggregated feedback.
Overview & Objective
The MAPS Project is a student-centric initiative to chart the rapidly evolving higher education system and surface inequities to higher ed decision-makers. Its purpose is to Model, Analyze, Prototype, and Share how the changing structure of higher education may help or hinder the creation of equitable outcomes for students. It focuses on visualizing high-quality data to chart critical trends on student demographics and institutional performance.
Partners
The project is in partnership with the Sorensen Impact Institute, the National Institute for Student Success at Georgie State University.
Funders
![]()
Status & Next Steps
Dashboards are currently live and being maintained.
Approach
Teams created three interactive dashboards that deliver actionable insights to higher education leaders and decision-makers:
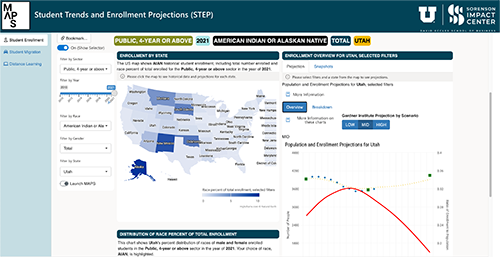
- Student Trends and Enrollment Projections (STEP), which visualizes relationships between population data, enrollment data, and the potential impacts of trends like distance learning.
- The Institutional Equity Outcomes Dashboard, which displays national IPEDS (Integrated Postsecondary Education Data System) data around key themes including enrollment, retention, graduation, and outcomes to surface and examine disparities in institutions.
- The Financial Health Dashboard, which offers a first-of-its-kind visibility into the financial health of more than 3,000 colleges and universities nationwide and the system as a whole.
Details
The MAPS Project is a three-year initiative. In 2022 it launched the Institutional Equity Outcomes Dashboard. Since, all three dashboards are in production.
Contact
 Jim Agutter
agutterja@design.utah.edu
Resources


